Welcome to the Website Monitor Setup Guide
With the launch of Website Monitor v1.1, we've made it easier than ever to keep track of your site's health, performance, and uptime. This guide will walk you through every step from setting up your monitor to viewing detailed reports and insights.
Whether you're new to monitoring or a developer managing multiple sites, you'll find everything you need right here.
Step 1: Create Your Account
Before you can start monitoring, you’ll need an account.
Create your account here.
Once registered and verified, log in and go to the Website Monitor page.
Step 2: Set Up Your First Monitor
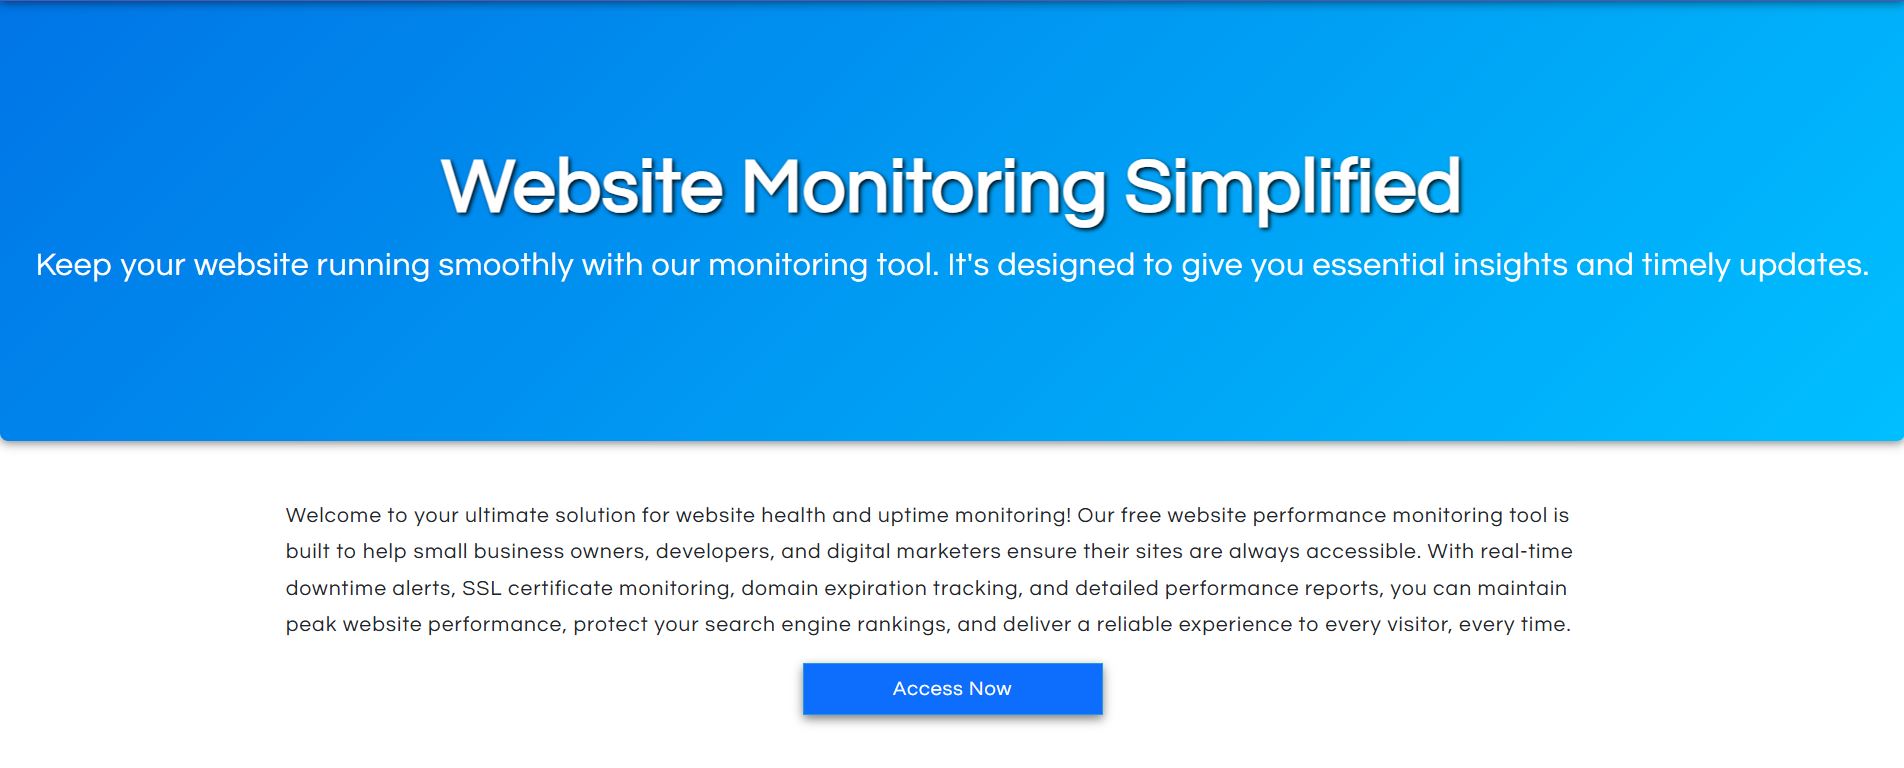
On the Website Monitor page, click the "Access Now" button. You'll see the setup screen like this:
Here’s how to set up your project:
- Choose a Plan - Select the FREE plan to get started.
- Select Your Website Protocol - Most modern sites use HTTPS.
- Enter Your Domain - Type your domain name (e.g., example.com).
- Click "Create Project" - That’s it! No verification needed.
Step 3: Explore the Monitor Overview Page
Once you create a project, you’ll be taken directly to the Project Overview no verification step required!
What You'll See:
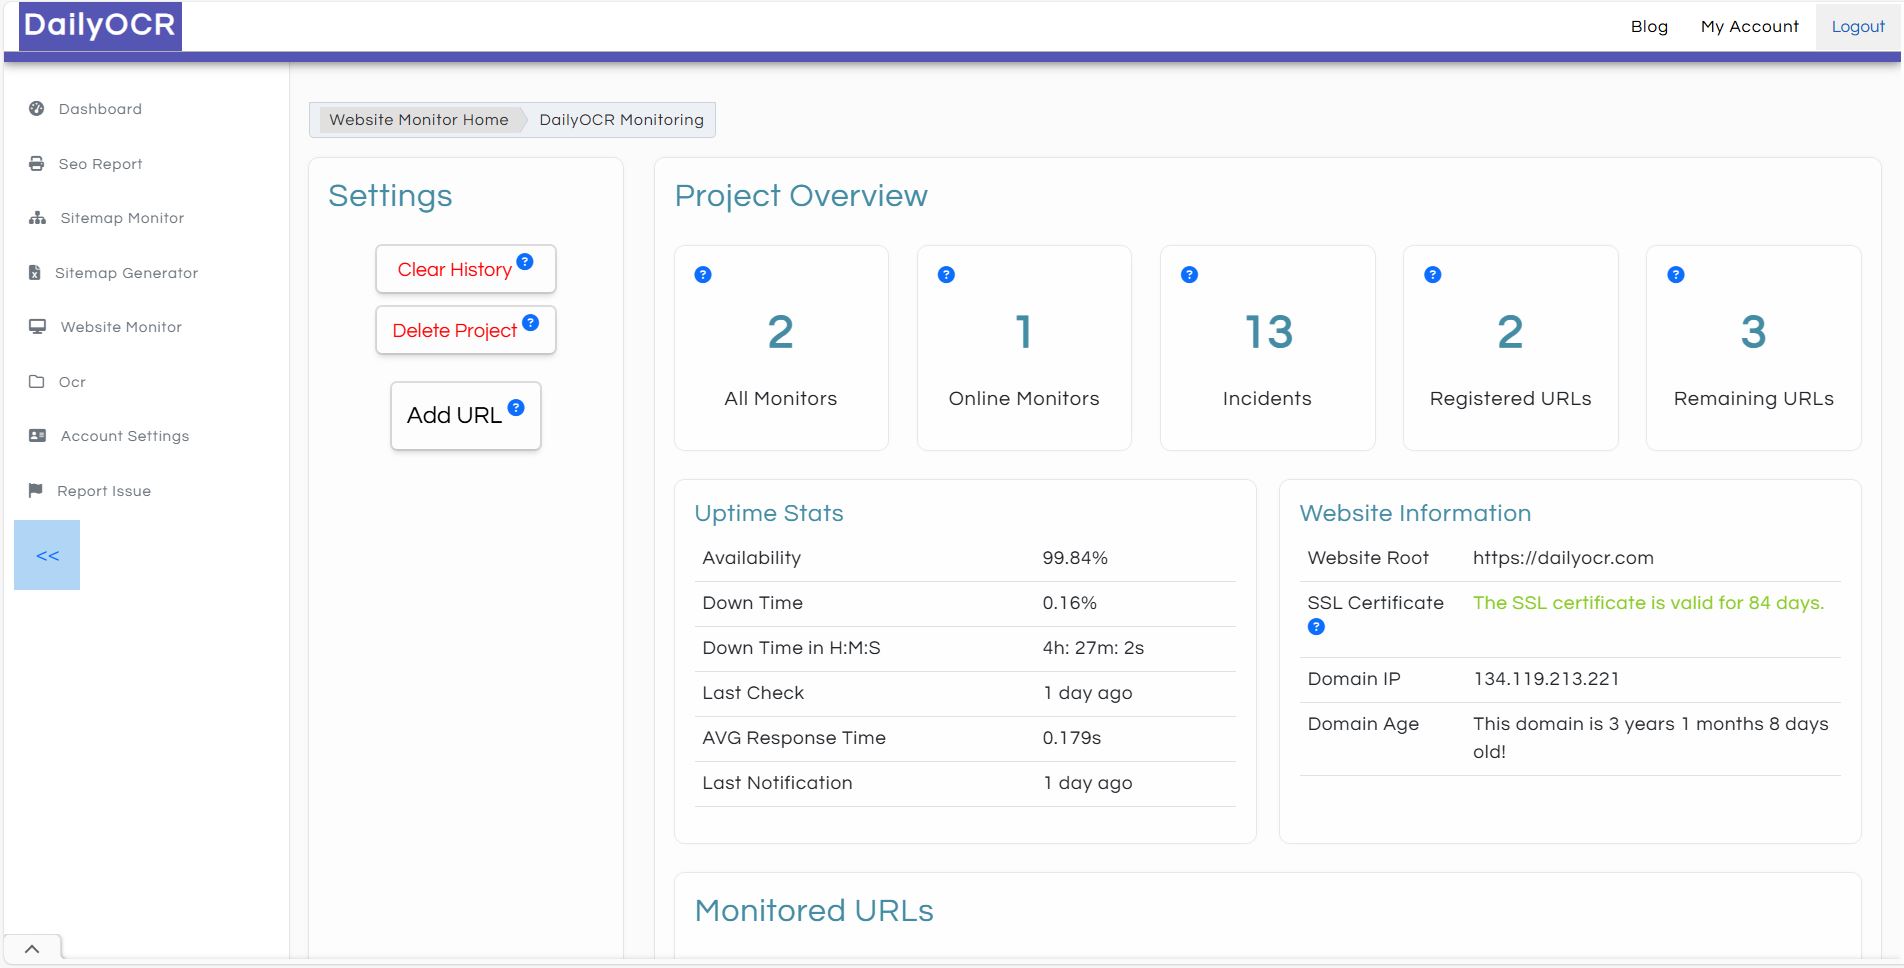
- General Info: Name, domain, status.
- Uptime Stats: Overview of recent performance.
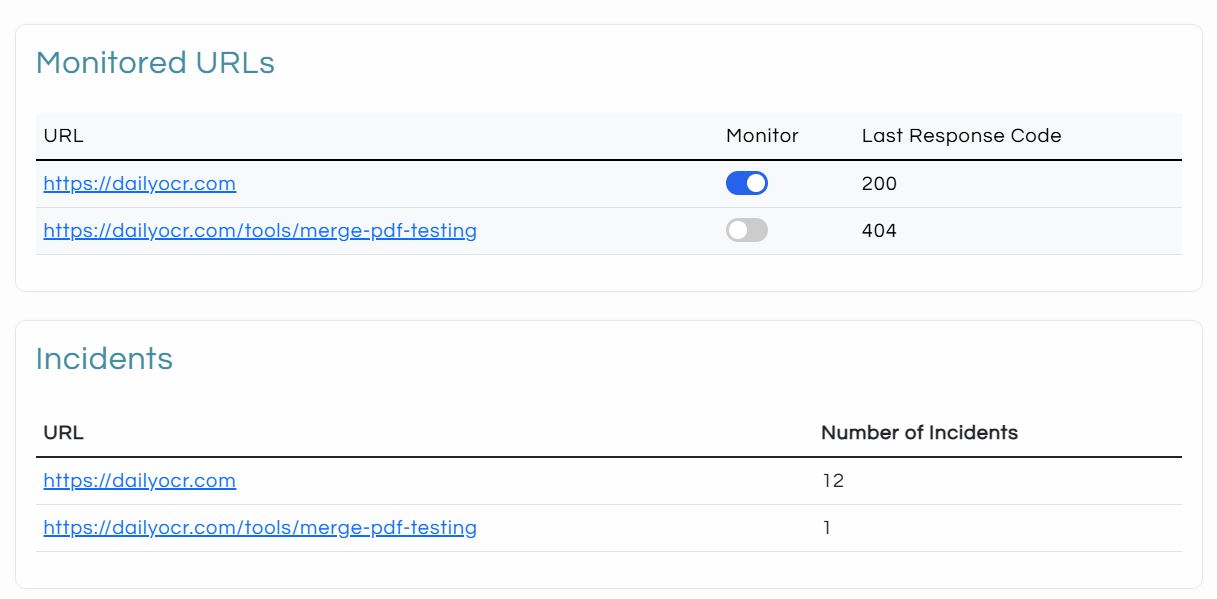
- Monitored URLs: Pages being tracked.
- Incidents: List of recent monitoring issues.
Note: The root page of your website is added automatically, but monitoring is turned OFF by default. Click the link under Monitored URLs to activate it.
Step 4: Activate and Customize Monitoring
Clicking on a monitored URL takes you to this page:
Here's what to do:
- Turn on Monitoring - Use the toggle switch to activate the monitor.
- Set Check Frequency - Choose how often you want the site to be checked (default is every 5 minutes).
Once activated, you’ll start receiving alerts if any issues are detected.
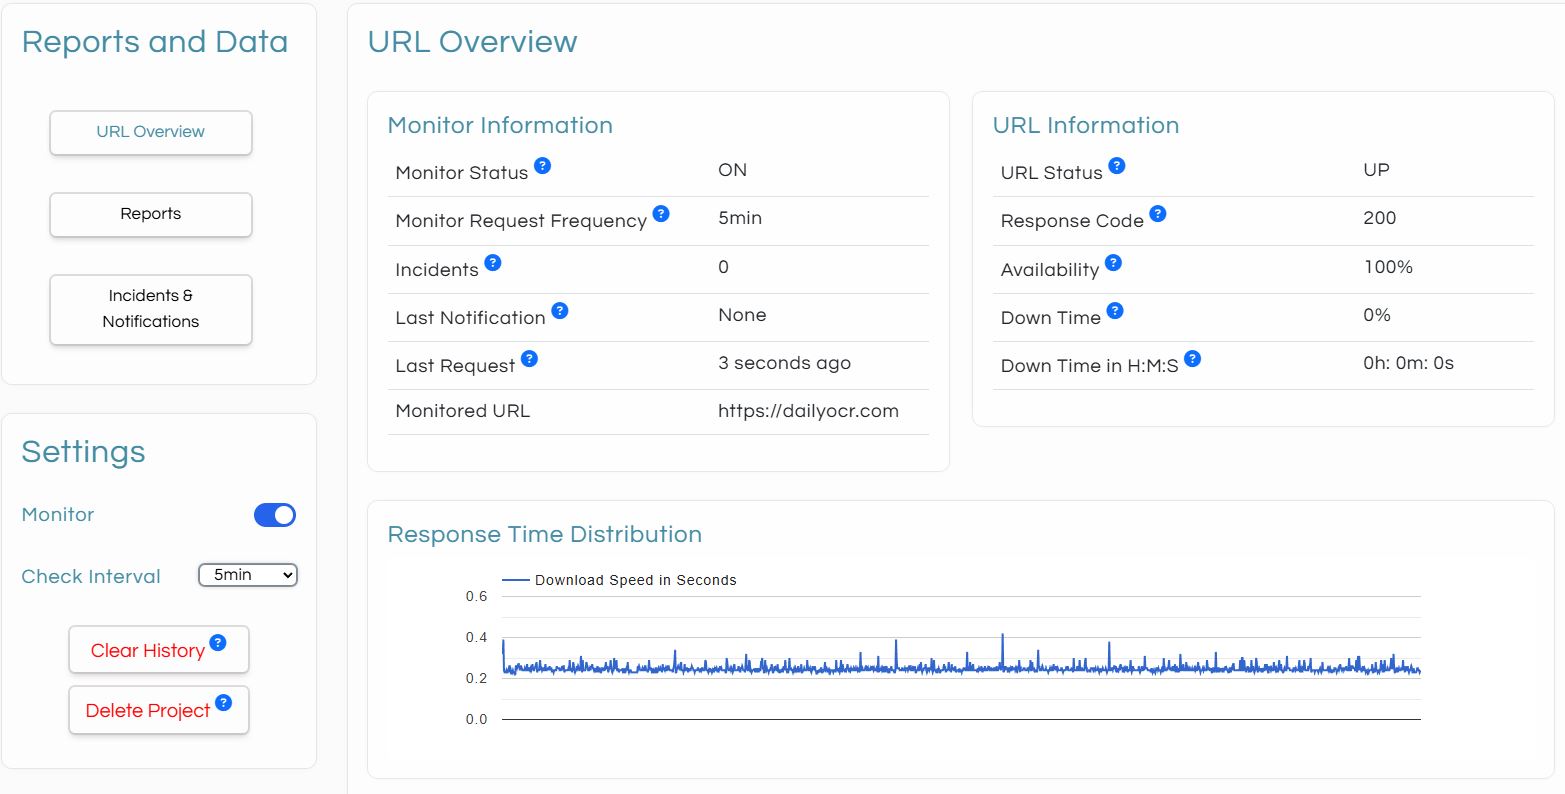
Monitor Page Overview
Key Sections:
- Reports & Data - View alerts, status reports, and incident logs.
- Settings - Turn the monitor on/off, change frequency, or delete data.
- Page Content - Visual graphs and data breakdown based on your selected data retention period.
Step 5: Understand Reports
Access detailed reports about your website's performance:
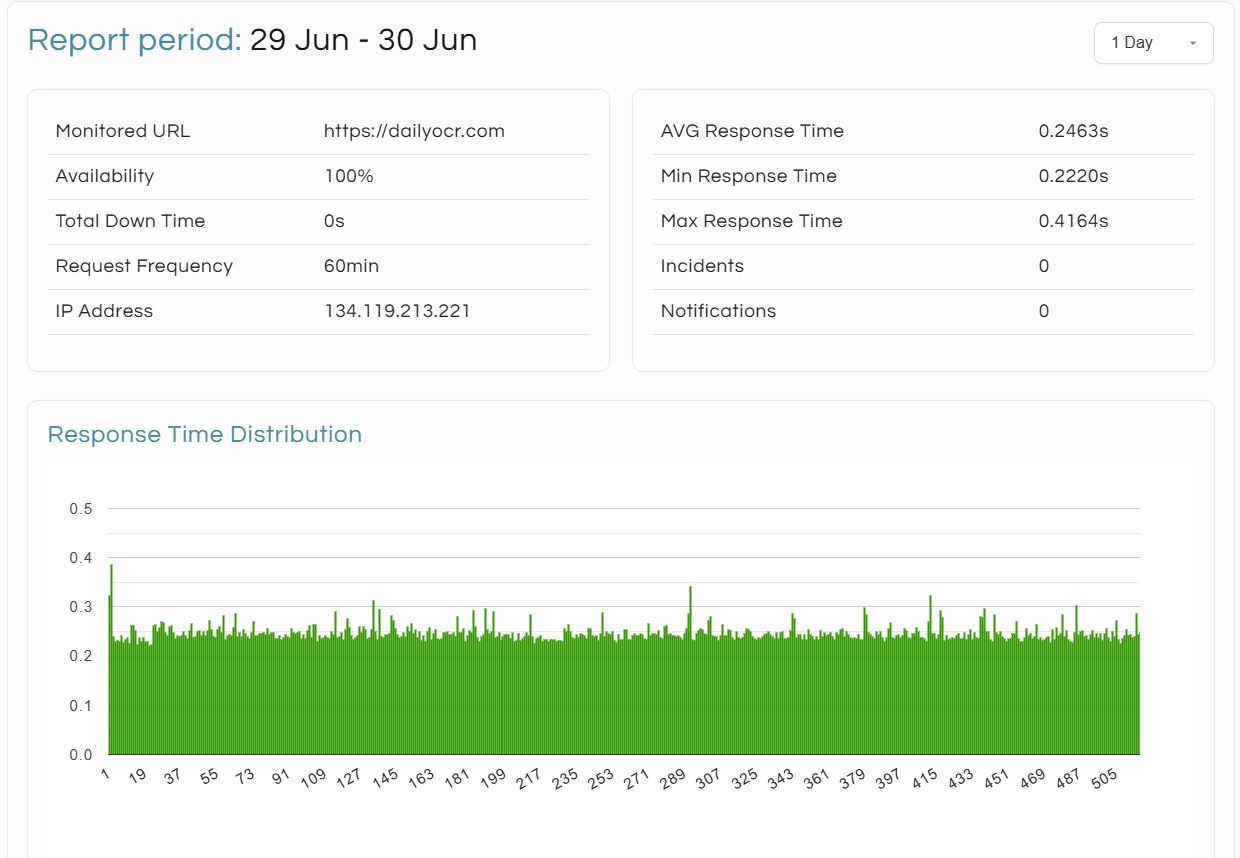
- Default View - Shows the last 24 hours of activity.
- Choose Timeframe - Use the dropdown in the top-right to select 1, 7, or 30 days. The graphs and stats will automatically update.
- Download your report in PDF format by clicking the download button at the bottom of the page.
You're All Set!
Now your site is being monitored 24/7. You’ll get notified if something goes wrong—whether it’s downtime, slow response, or connection issues.
Need help? Reach out anytime from your dashboard or visit dailyocr.com.
Comments (0)